| | --- |
| | license: mit |
| | dataset_info: |
| | features: |
| | - name: image |
| | dtype: image |
| | - name: label |
| | dtype: |
| | class_label: |
| | names: |
| | '0': Baby cry |
| | '1': Chainsaw |
| | '2': Clock tick |
| | '3': Cow |
| | '4': Dog |
| | '5': Fire crackling |
| | '6': Frog |
| | '7': Helicopter |
| | '8': Person sneeze |
| | '9': Pig |
| | '10': Rain |
| | '11': Rooster |
| | '12': Sea waves |
| | splits: |
| | - name: train |
| | num_bytes: 62618318 |
| | num_examples: 1625 |
| | download_size: 58577292 |
| | dataset_size: 62618318 |
| | configs: |
| | - config_name: default |
| | data_files: |
| | - split: train |
| | path: data/train-* |
| | --- |
| | |
| | ## Mel-Spectrogram Image Dataset (Generated via Custom Pipeline) |
| |
|
| | > **This dataset was fully generated through my notebook |
| | > *“Building an Audio Classification Pipeline with DL”* available on my profile.** |
| | > It represents a complete end-to-end transformation from raw audio to clean, balanced Mel-spectrogram images suitable for deep learning. |
| |
|
| | --- |
| |
|
| | ### **Dataset Summary** |
| |
|
| | | Property | Description | |
| | | ---------------------------- | --------------------------------------------- | |
| | | **Number of Classes** | 13 distinct audio categories | |
| | | **Original Audio per Class** | ~40 raw recordings | |
| | | **Average Duration** | ~5 seconds per audio file | |
| | | **Final Images per Class** | 125 Mel-spectrogram images | |
| | | **Final Dataset Size** | 13 × 125 = **1625 images** | |
| | | **Sampling Rate** | Standardized to **16 kHz** | |
| | | **Audio Length** | Uniform **5-second** fixed length | |
| | | **Spectrogram Type** | 128-Mel frequency bins, `melspectrogram → dB` | |
| |
|
| | --- |
| |
|
| | ### **High-Level Processing Pipeline** |
| |
|
| | The dataset was built using a **fully custom preprocessing, cleaning, and augmentation pipeline**, implemented step-by-step in the notebook. |
| |
|
| | #### **1. Data Ingestion** |
| |
|
| | * Loaded all raw audio files from 13 folders |
| | * Parsed metadata (sample rate, duration, amplitude, SNR, etc.) |
| |
|
| | #### **2. Cleaning & Standardization** |
| |
|
| | * Removed corrupt, silent, or unreadable audio files |
| | * Normalized peak amplitudes |
| | * Trimmed silence using `librosa.effects.trim` |
| | * Performed noise reduction (`noisereduce`) |
| | * Converted all audio to **mono** |
| | * Resampled to **16,000 Hz** |
| | * Ensured each sample is **exactly 5 seconds** |
| |
|
| | #### **3. Dataset Balancing** |
| |
|
| | * Used augmentation for minority classes |
| | * Used controlled undersampling or oversampling where necessary |
| | * Verified all classes contain equal counts |
| |
|
| | #### **4. Audio Augmentation (Used for Balancing & Variability)** |
| |
|
| | Augmentations built with **audiomentations**: |
| |
|
| | * Time shift |
| | * Pitch shift |
| | * Time stretching |
| | * Gaussian noise injection |
| | * Random perturbations for robustness |
| |
|
| | #### **5. Splitting & Chunking** |
| |
|
| | * Long samples were split into 5-second chunks |
| | * Shorter samples padded to match target duration |
| | * Ensured strict uniformity before feature extraction |
| |
|
| | #### **6. Mel-Spectrogram Generation** |
| |
|
| | Converted all cleaned audio files into Mel-spectrogram images using: |
| |
|
| | * `n_fft = 1024` |
| | * `hop_length = 512` |
| | * `n_mels = 128` |
| | * Converted to decibel scale (`power_to_db`) |
| | * Saved images in **RGBA format** to preserve color-mapped spectral information |
| |
|
| | --- |
| |
|
| | ### **Final Technical Description** |
| |
|
| | > **“The final dataset consists of 13 audio classes, each expanded to exactly 125 Mel-spectrogram images through a rigorous pipeline of cleaning, normalization, augmentation, noise reduction, resampling, duration standardization, and feature extraction. All processing steps were implemented in my notebook *‘Building an Audio Classification Pipeline with DL,’* where raw 5-second audio recordings were transformed into high-quality Mel-spectrogram images suitable for deep learning models.”** |
| |
|
| | --- |
| |
|
| | ### **Examples of the Images** |
| |
|
| | 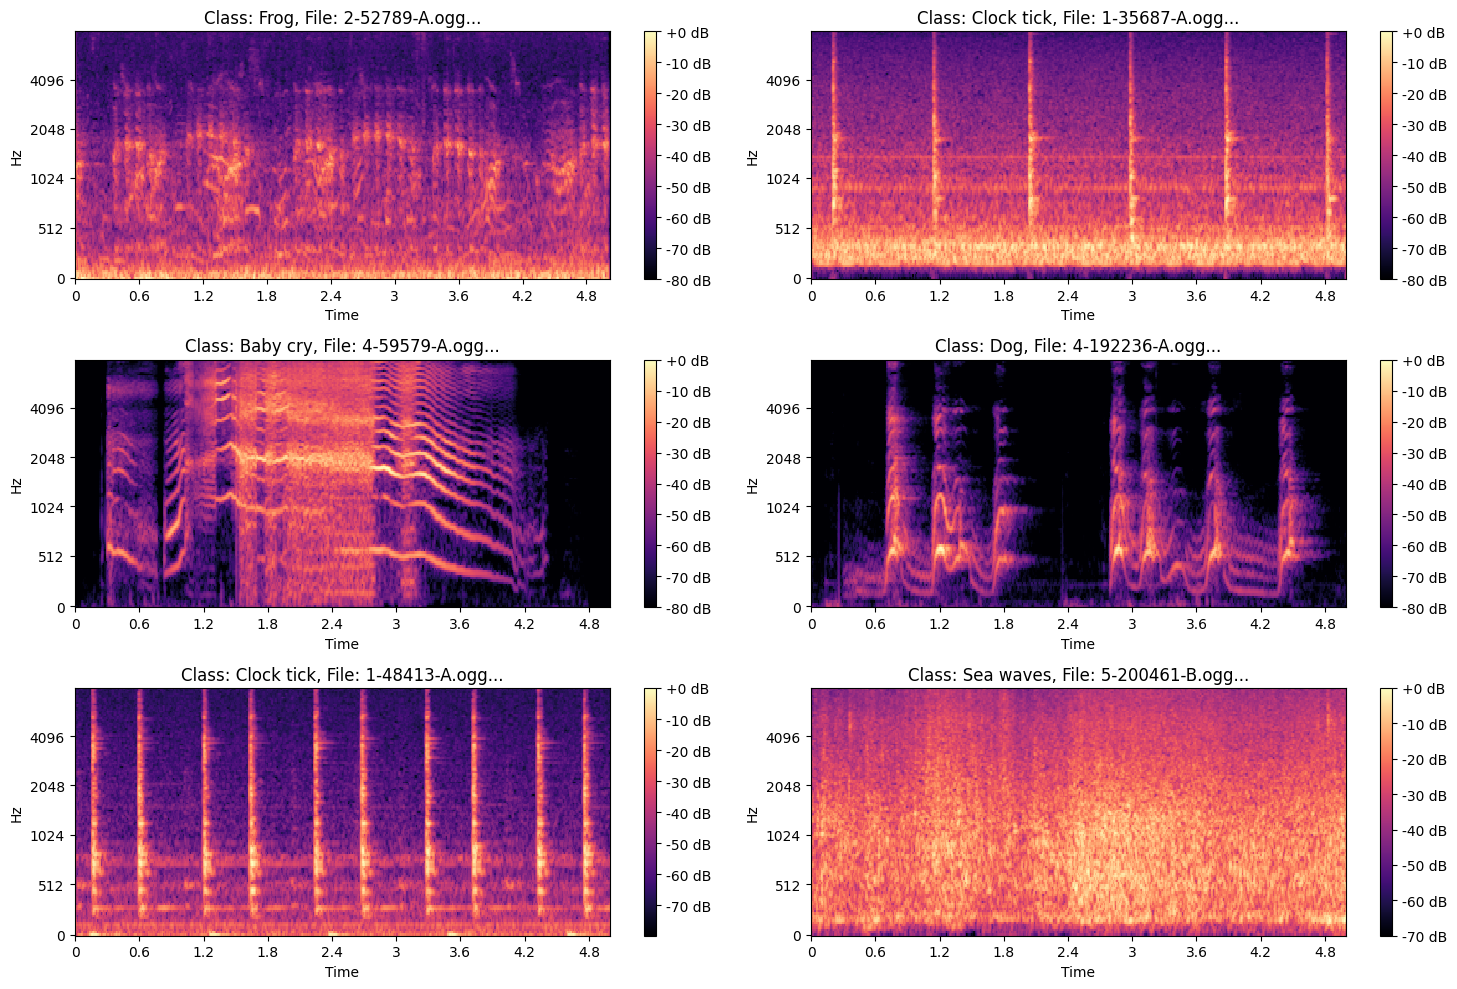 |
| |
|
| | .png?generation=1763570855911665&alt=media) |
